Nordic Privacy Arena 2025 – key insights and discussion topics
Nordic Privacy Arena (NPA) is the most significant Nordic conference focusing on data protection and privacy. It is held annually

The data protection survey was conducted from 2021 onwards. Responses to the survey were solicited via email and social media.
A response period of approximately 2 months was given and no profiling of respondents was carried out. The profile of the respondents and the size of the organisations has remained very similar, so the results are now available for three years. From these responses, we can already see trends in a number of areas, such as ‘are staff trained regularly’ or ‘is the GDPR useful’.
The results are treated in the report as a statistical set, and no individual respondent’s answers can be inferred from the results. Personal data associated with the questionnaires will be deleted from the system within 3 months. Choice and rating questions are reported as graphs. The proprietary responses to the open-ended questions are listed in the report, with some highlights in the survey summary.
It can be assumed that the respondents to the survey represent people who are at least somewhat interested in the subject. On the other hand, it can be inferred from the responses to the survey that some of them are quite critical of the requirements of the Data Protection Act.
As far as the respondents are concerned, the distribution of the size of the organisations was very similar in the years of response. It is worth noting that almost 60% of respondents work in organisations with more than 50 employees and just over 25% of respondents work in organisations with more than 1,000 employees. Clearly, both small and large organisations are interested in GDPR issues. See Figure 1.
Figure 1: Number of staff in the organisation
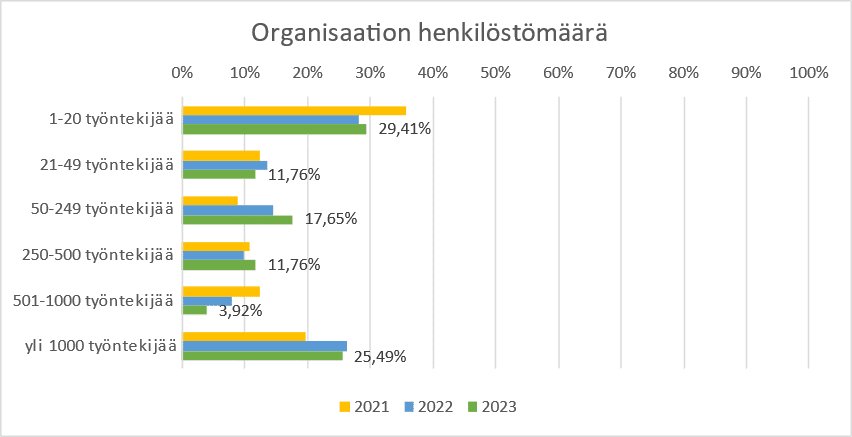
Työntekijää = (Number of) Employees
The distribution of organisations by sector was also very similar across the years of response. Respondents were a diverse mix of companies and public sector actors. See Figure 2.
Figure 2: Sector of the enterprise/organisation
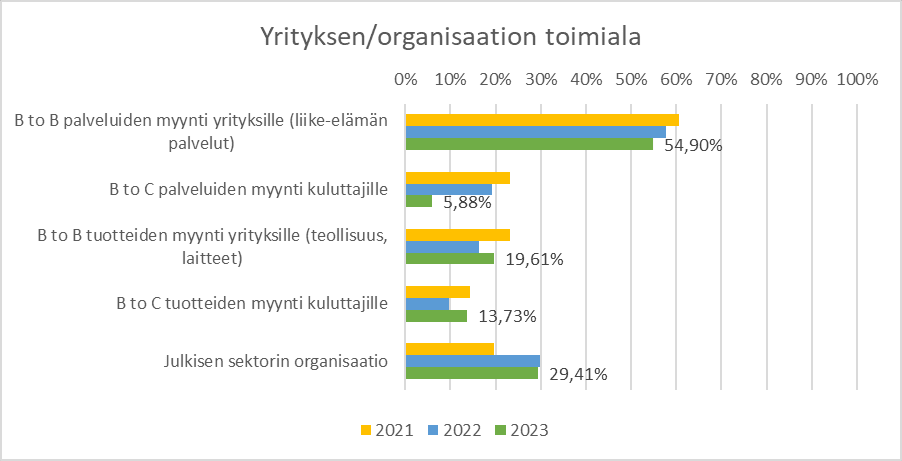
B to B palveluiden myynti yrityksille (liike-elämän palvelut) = Sale of B to B services to businesses (business services)
B to C palveluiden myynti kuluttajille = Sale of B to C services to consumers
B to B tuotteiden myynti yrityksille (teollisuus, laitteet) = B to B product sales to companies (industry, equipment)
B to C tuotteiden myynti kuluttajille = Sale of B to C products to consumers
Julkisen sektorin organisaatio = Public sector organisation
The distribution of respondents’ professional positions was very similar across these years. Respondents represent both decision-makers and employees. See Figure 3.
Figure 3: Professional positions of respondents
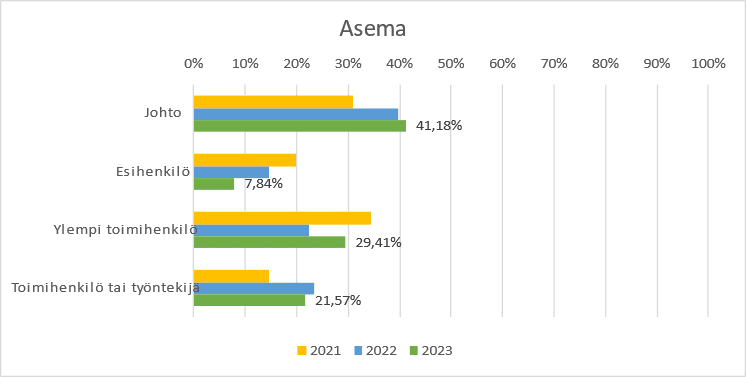
Johto = Upper management
Esihenkilö = Manager
Ylempi toimihenkilö = Senior staff member
Toimihenkilö tai työntekijä = Staff member or employee
With regard to the working environment, respondents included employees from companies operating in Finland, companies operating internationally and international companies with headquarters abroad. See figure 4.
Figure 4: Respondents’ working environments
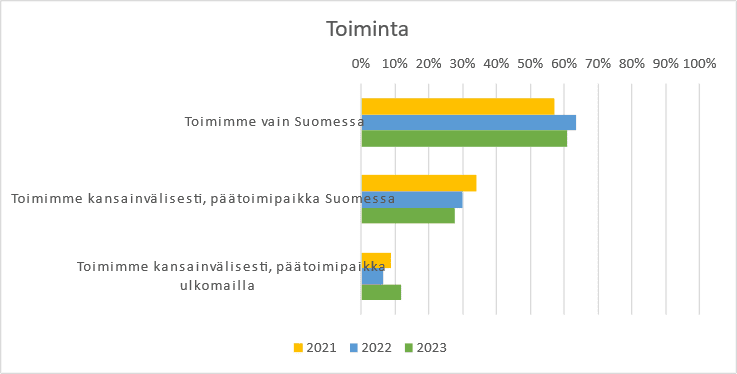
Toimimme vain Suomessa = We only operate in Finland
Toimimme kansainvälisesti, päätoimipaikka Suomessa = We operate internationally, with headquarters in Finland
Toimimme kansainvälisesti, päätoimipaikka ulkomailla = We operate internationally, with headquarters abroad
Return here to the research results!
Juha Sallinen
Entrepreneur, Information Management and Technology Architect
GDPR Tech
040 5666 900
juha@gdprtech.com